Quarter Two
|
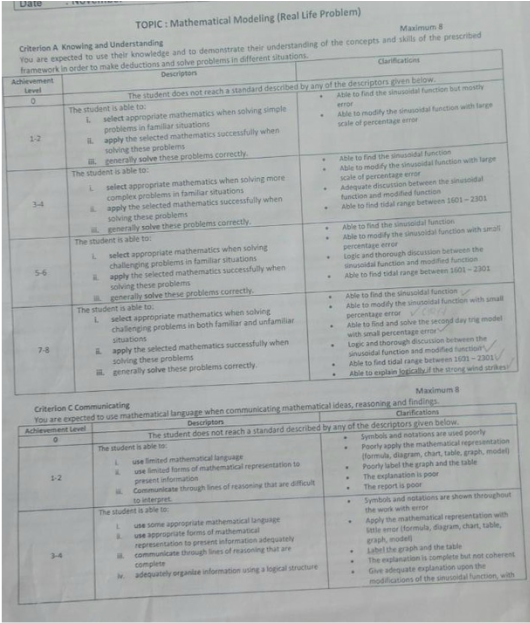
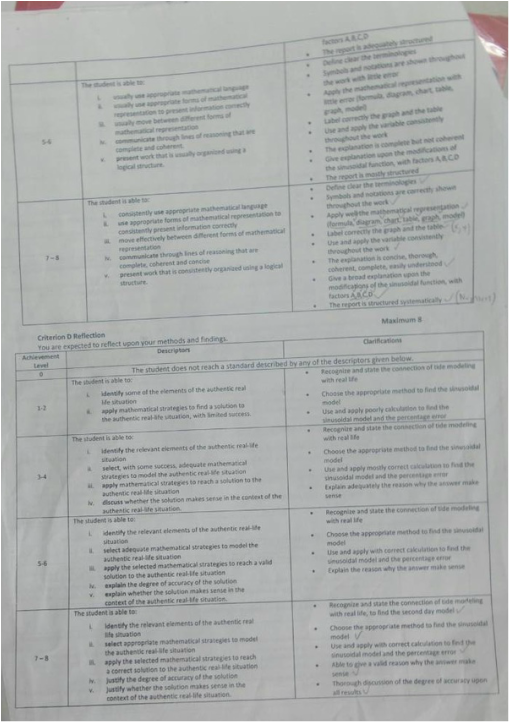
This quarter, math focused on understanding functions and how to apply them to real life situations. My best work this quarter was an investigation on tidal heights against time and how they can be mapped through a sinusoidal equation. For this assignment, my grade was 8, 8, 7. This assignment is my best work because it was my first typed investigation, and something that I personally think was quite challenging. It required analysis and application, depending on the given data. I also had to learn to use a new software called Graphmatica for the assignment, and sometimes the program wouldn't cooperate with me. What I think I did well was do the test diligently, and I did not take shortcuts in any of the steps. Although it was tedious, I did things one step at a time, which helped with the quality of the work as well as understanding the different trends. Even in changing the numbers, I did it by decimal instead of by whole numbers for accuracy. In the future, I should be thorough in identifying the factors that affect tidal height, to broaden my understanding on perspectives. This assignment helped me understand the key concept systems, because the assignment involved understanding the relationship between sinusoidal equations with real life problems. However, it also helped me understand another layer of systems, and how not all systems are absolute, because of external factors involved that are difficult to consider in a basic sinusoidal equation.
|
Quarter One
This quarter, my best work was a brochure about stellar magnitude. Throughout math, we learned about different things, and one of the concepts was logarithms and how they're applied in real life. Our class was given a few topics to choose from, and I choose stellar magnitude on the pretense that it was about stars. This work is my best work, because I had to understand a math application I was completely clueless about prior, and it was a rather difficult concept to grasp. Additionally, I had to then translate my understanding into the form of a brochure, which was difficult because I had to collaborate descriptions and raw mathematics. However, I did well in trying my hardest into understanding the concepts, which was something I was close to giving up on at the beginning. I also did well on making a brochure that was somewhat aesthetic, while still being quite clear on the concept of stellar magnitude. In the future, I should improve the clarity of these descriptions, so that readers of my brochure can learn more from less. The key concept for this project is systems, because I explored the interactions between logarithms and how they're applicable in real life, in the form of stellar magnitude.
My goal this year is to get a seven in my report card and understand the concept of mathematics thoroughly.
